Here we will learn how to use a sample space, including listing outcomes, creating sample space diagrams and finding probabilities.
There are also sample space worksheets based on Edexcel, AQA and OCR exam questions, along with further guidance on where to go next if you’re still stuck.
A sample space diagram is used to display all possible outcomes, this could be as a list or a table of values. Making a list of all possible outcomes is known as enumeration.
To create a sample space diagram we need to think about the possible outcomes of a situation.
Let’s say we were to flip a fair coin and at the same time roll a fair six-sided die.
The sample space for this situation could be written as a list of the possible combinations.
(H, 1), \ (H, 2), \ (H, 3), \ (H, 4), \ (H, 5), \ (H, 6), \ (T, 1), \ (T, 2), \ (T, 3), \ (T, 4), \ (T, 5), \ (T, 6)
The sample space for more complicated situations is often shown in a table.
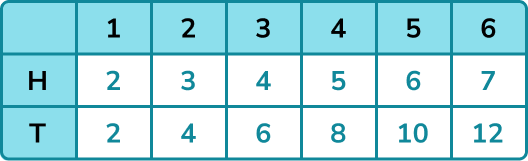
If flipping the coin and rolling the die were part of a game and the side the coin shows changed the score of the die, we could show this in a sample space diagram.
In this game, the coin showing heads adds 1 to the value on the die. The coin showing tails doubles the value on the die.
The sample space diagram shows all the possible outcomes for this game.
We can use sample space diagrams to find probabilities.
Jon plays the game and wants to know the probability of getting a score of more than 6.
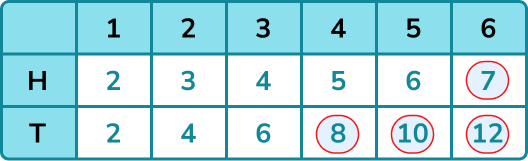
We can see from the table that there are 4 scores more than 6.
There are a total of 12 possible outcomes from this game.
Using the theoretical probability formula,
The tables used for sample space diagrams can also be referred to as two-way tables.
Step-by-step guide: Two-way tables (coming soon)